Indicators are the tools technical traders use to extract meaning from price and volume data. They don’t predict the future — they measure the present state of momentum, trend, and volatility in a structured, repeatable way.
The mistake most beginners make is using too many indicators at once. Four indicators in conflict produce confusion. Two indicators in agreement produce conviction.
This guide covers the five most essential indicators for crypto trading — what each one measures, how to read its signals, and how to combine them effectively.
Before You Start: Two Categories of Indicators
Lagging indicators: Based on past price data. They confirm trends after they’ve begun but are more reliable for trend direction. Examples: Moving Averages, MACD.
Leading indicators: Attempt to predict future price movements based on current conditions. More sensitive but produce more false signals. Examples: RSI, Bollinger Bands.
Neither category is “better.” The most effective approach uses both: lagging indicators for trend direction, leading indicators for timing.
Indicator 1: RSI (Relative Strength Index)
What It Measures
RSI measures the speed and magnitude of recent price changes on a scale of 0–100. It answers one question: is this asset currently overbought or oversold?
How It’s Calculated
RSI compares average gains to average losses over 14 periods (the default). A reading of 100 means price has only gone up. A reading of 0 means price has only gone down.
How to Read RSI
Above 70 — Overbought:
The asset has risen rapidly and may be due for a pullback or consolidation. This doesn’t mean sell immediately — in strong trending markets, RSI can stay above 70 for extended periods. It’s a caution signal, not an automatic sell trigger.
Below 30 — Oversold:
The asset has fallen rapidly and may be due for a bounce or reversal. Same caveat — in strong downtrends, RSI can stay below 30. Use it as a context signal, not a standalone buy trigger.
50 level — Trend confirmation:
RSI above 50 indicates bullish momentum; below 50 indicates bearish. Many traders use the 50 level as a simple trend filter — only take long positions when RSI is above 50, only shorts below.
RSI Divergence — The Most Powerful RSI Signal
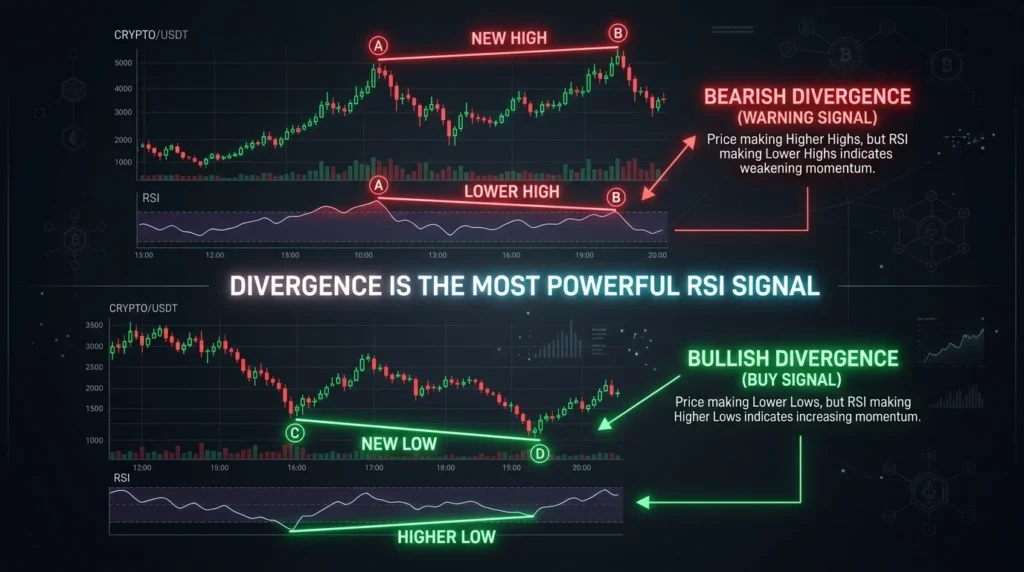
Divergence occurs when RSI and price move in opposite directions. This is often more useful than overbought/oversold levels alone.
Bearish divergence: Price makes a new high but RSI makes a lower high. Momentum is weakening even as price rises — a warning that the uptrend may be losing strength.
Bullish divergence: Price makes a new low but RSI makes a higher low. Momentum is improving even as price falls — a warning that the downtrend may be weakening.
Divergences don’t always lead to immediate reversals, but they’re a valuable early warning signal worth monitoring.
RSI in Practice (2026 Context)
Bitcoin’s RSI dropped to 25.6 in early March 2026 — only the third time in Bitcoin’s history it had fallen below 30. The previous two instances (2015 at ~$200 and December 2018 at ~$3,500) preceded major recoveries of +9,900% and +1,700% respectively. RSI at extreme levels provides historical context — not guarantees, but meaningful reference points.
Indicator 2: MACD (Moving Average Convergence Divergence)
What It Measures
MACD measures the relationship between two exponential moving averages to identify trend direction and momentum shifts. It answers: is the trend strengthening or weakening, and is it bullish or bearish?
Components
MACD Line: The difference between the 12-period EMA and the 26-period EMA.
Signal Line: A 9-period EMA of the MACD line — a smoothed average of recent MACD values.
Histogram: The difference between the MACD line and the signal line, displayed as bars above or below zero.
How to Read MACD
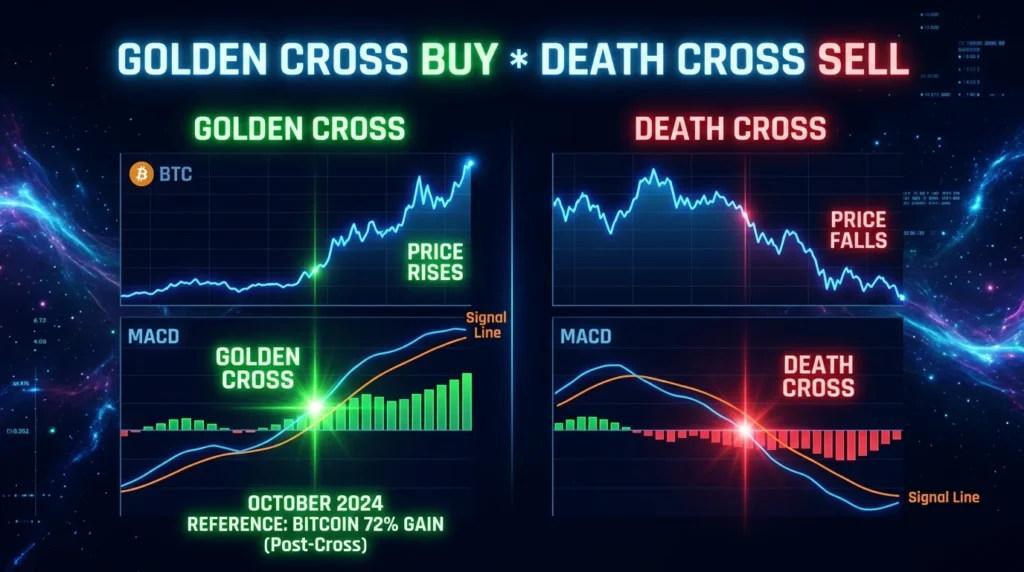
Crossover signals (the most watched):
- Golden Cross: MACD line crosses ABOVE the signal line → bullish signal, potential buy
- Death Cross: MACD line crosses BELOW the signal line → bearish signal, potential sell
Zero line crossovers:
- MACD crosses above zero → trend has turned bullish overall
- MACD crosses below zero → trend has turned bearish overall
Histogram:
- Histogram bars growing larger (positive) → bullish momentum increasing
- Histogram bars shrinking (positive to zero) → bullish momentum fading
- Histogram bars growing larger (negative) → bearish momentum increasing
- Histogram bars shrinking (negative to zero) → bearish momentum fading
MACD Divergence
Like RSI, MACD divergence is a powerful signal. Price making new highs while MACD makes lower highs = bearish divergence. Price making new lows while MACD makes higher lows = bullish divergence.
MACD’s Limitation
MACD is a lagging indicator — it’s based on moving averages which smooth past data. In sideways, choppy markets it generates frequent false signals. It works best in clearly trending markets.
October 2024 example: Bitcoin printed a MACD golden cross at approximately $65,000. BTC subsequently surged past $110,000 — a 72% gain following the crossover signal.
Indicator 3: Moving Averages (MA / EMA)
What They Measure
Moving averages smooth out price data to identify trend direction by calculating an average price over a specified period.
Simple Moving Average (SMA): Equal weight to all periods in the calculation.
Exponential Moving Average (EMA): More weight to recent prices — responds faster to price changes. Generally preferred in crypto for its faster responsiveness.
The Most Watched Moving Averages in Crypto
- 20 EMA: Short-term trend, commonly used for swing trading
- 50 EMA/SMA: Medium-term trend
- 200 EMA/SMA: Long-term trend — the most widely watched
The 200 MA as a trend filter:
When price is above the 200-day MA → broad bullish environment
When price is below the 200-day MA → broad bearish environment
Many long-term investors use the 200-day MA as a simple rule: only buy when Bitcoin is above the 200-day MA.
Golden Cross and Death Cross
Golden Cross: The 50-day MA crosses above the 200-day MA. Broadly bullish — signals a long-term trend shift upward. Historically reliable but lags significantly (the cross happens after much of the move).
Death Cross: The 50-day MA crosses below the 200-day MA. Broadly bearish — signals a long-term trend shift downward.
Dynamic Support and Resistance
Moving averages act as support in uptrends and resistance in downtrends. Price often pulls back to a key MA (like the 50 EMA) and finds buying support there during uptrends. This makes MAs practical for setting entries and stop-losses.
Indicator 4: Bollinger Bands
What They Measure
Bollinger Bands measure price volatility relative to a moving average. They consist of three lines:
- Middle Band: 20-period Simple Moving Average
- Upper Band: Middle Band + 2 standard deviations
- Lower Band: Middle Band – 2 standard deviations
Approximately 95% of price action falls within the bands under normal market conditions.
How to Read Bollinger Bands
Price touching the upper band:
The asset is trading at the high end of its recent range. Can signal overbought conditions and potential pullback — or, in strong trends, momentum continuation.
Price touching the lower band:
The asset is at the low end of its range. Can signal oversold conditions and potential bounce.
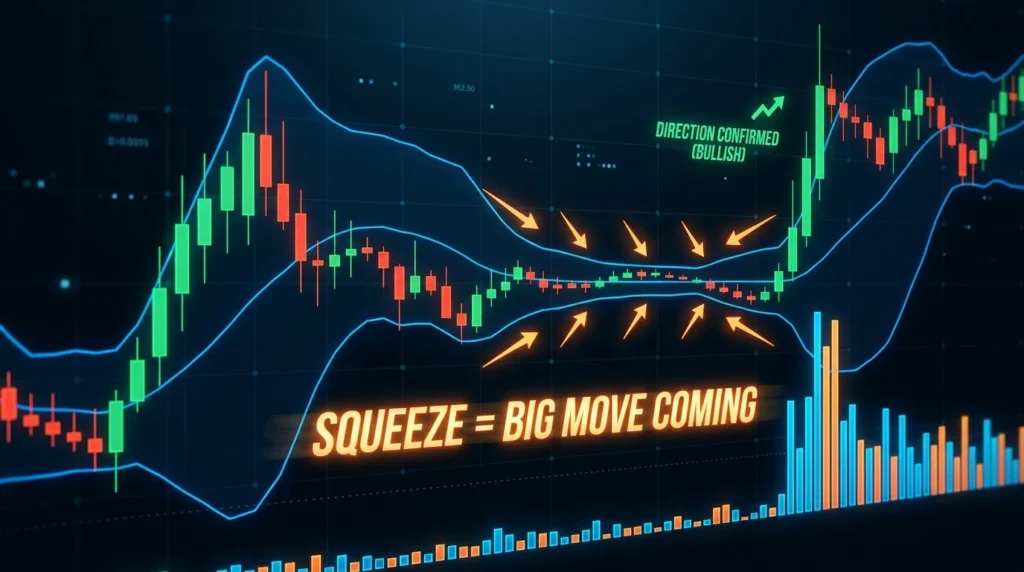
The Bollinger Squeeze — The Most Important Signal:
When the bands narrow significantly (compress together), volatility is at a low point and a major price move is approaching. The bands don’t tell you which direction — just that a significant move is coming. Wait for the actual breakout with volume confirmation.
Historically, approximately 40% of Bitcoin Bollinger squeezes have broken downward — which means direction confirmation from other indicators (RSI, MACD) is essential.
Band width as volatility measure:
Wide bands = high volatility (trending or recently volatile market)
Narrow bands = low volatility (consolidation, squeeze condition)
Indicator 5: Volume
What It Measures
Volume is the total amount of an asset traded during a period. While technically not a “traditional” indicator, volume is the foundation of all technical analysis confirmation.
Key Volume Signals
High volume breakout above resistance: Genuine strength — real buyers are participating.
Low volume breakout above resistance: Suspicious — may reverse quickly. Wait for volume confirmation.
Price drops on high volume: Strong selling pressure — the decline is meaningful.
Price drops on low volume during uptrend: Normal pullback, not a trend change.
Volume declining while price rises: Distribution — institutional money may be selling into the rally while retail buys.
Volume expanding while price rises: Accumulation — real buying pressure supporting the move.
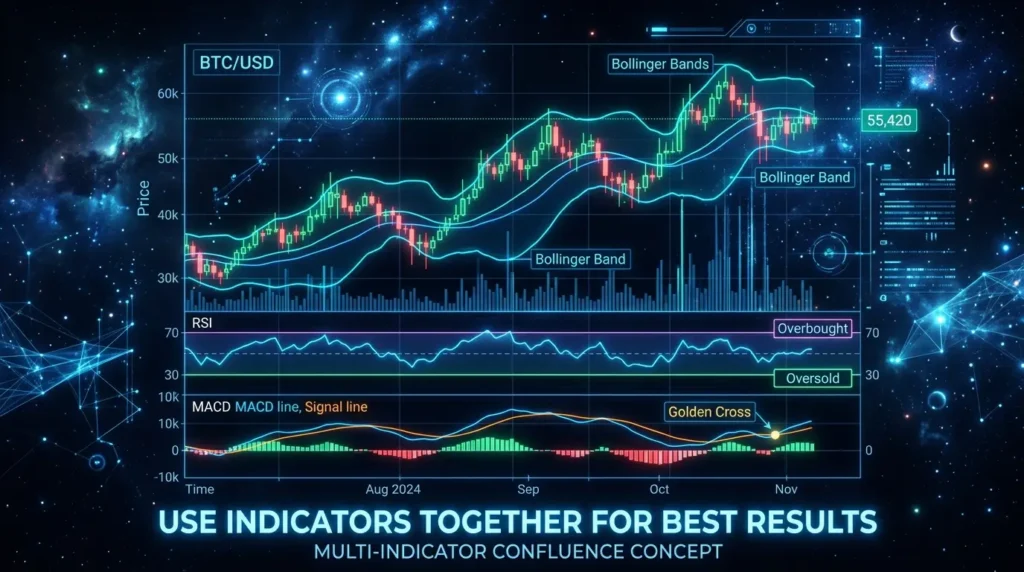
Combining Indicators: The Multi-Confirmation Framework
Single indicators produce false signals regularly. MACD crossovers win approximately 40% of the time on their own. The best candlestick patterns top out at 60%. However, combining indicators dramatically improves results. Gate.io’s January 2026 analysis found that pairing RSI with MACD produced a 77% win rate in backtesting.
The practical three-step framework:
Step 1 — RSI (Momentum check):
Is RSI oversold (below 30) or overbought (above 70)? Below 30 = potential buy zone. Above 70 = potential sell zone.
Step 2 — MACD (Trend confirmation):
Does the MACD histogram support the RSI reading? Is MACD turning from negative to positive (supporting the buy)? Is it turning from positive to negative (supporting the sell)?
Step 3 — Bollinger Bands (Volatility context):
Is price near the lower band (supporting the oversold RSI reading)? Near the upper band (supporting the overbought reading)? Is there a squeeze setup?
The strongest signal: RSI oversold + MACD turning bullish + price at lower Bollinger Band + high volume = high-conviction long setup.
The weakest setup: Single indicator signal with conflicting others and low volume.
Indicator Settings for Crypto
Default settings work well for most traders. However, crypto’s 24/7 nature and higher volatility mean some adjustments are commonly made:
RSI: 14 periods (standard). Some traders use 7 or 10 for faster signals on lower timeframes.
MACD: 12/26/9 (standard). Works well as-is for crypto.
Moving Averages: 20/50/200 EMAs are the most commonly used in crypto.
Bollinger Bands: 20-period, 2 standard deviations (standard). No common modification needed.
General rule: Don’t change settings without understanding why. Most traders lose their edge by over-optimizing indicators on historical data.
Common Indicator Mistakes
Using too many indicators: Six indicators producing mixed signals is worse than two clean ones confirming each other. Keep it simple — RSI + MACD + Volume covers most situations.
Treating overbought/oversold as automatic signals: RSI above 70 doesn’t mean “sell immediately.” In a strong bull market, RSI can stay above 70 for weeks. It’s context, not a trigger.
Ignoring price action: Indicators are derived from price. When a clear price pattern (like a breakout above resistance with strong volume) contradicts an indicator reading — price action generally takes precedence.
Not adjusting for market type: MACD works best in trending markets. RSI works best in ranging markets. Using MACD in a ranging market generates false signals. Always assess the market type first.
Acting on every crossover: MACD generates many crossovers in choppy markets that all fail. Use higher timeframes and require additional confirmation before acting.
Key Terminology
RSI (Relative Strength Index): Momentum oscillator measuring price change speed, 0–100 scale. Above 70 = overbought, below 30 = oversold.
MACD: Moving Average Convergence Divergence — shows momentum and trend direction through two EMA relationship.
Signal Line: 9-period EMA of the MACD line — crossovers with MACD generate buy/sell signals.
Histogram: Visual representation of the difference between MACD line and signal line.
Golden Cross (MACD): MACD line crosses above signal line — bullish signal.
Death Cross (MACD): MACD line crosses below signal line — bearish signal.
Bollinger Squeeze: When Bollinger Bands narrow significantly — signals imminent major price move.
EMA (Exponential Moving Average): Moving average that gives more weight to recent prices.
Divergence: When price and an indicator move in opposite directions — signals potential reversal.
Confluence: Multiple indicators aligning to support the same signal — increases reliability.
The Bottom Line
Master four indicators and use them together:
- RSI — Is price overbought or oversold? Is there divergence?
- MACD — What direction is momentum? Is it a golden or death cross?
- Moving Averages — What’s the overall trend? Is price above or below the 200 MA?
- Bollinger Bands — Is there a squeeze? Is price at extreme band levels?
Add volume as your constant confirmation tool.
Wait for confluence — two or more indicators agreeing before you act. Individual signals fail regularly. Aligned signals are significantly more reliable.
Practice these on TradingView’s free platform in paper trading mode before applying them to real capital. The first time you see RSI divergence play out exactly as described — followed by a reversal — you’ll understand viscerally why these tools matter. 📊
Disclaimer: This article is for informational purposes only and does not constitute financial advice. Cryptocurrency investments carry significant risk. Technical analysis does not guarantee profitable outcomes. Always conduct your own research before making investment decisions.


")
")