Understanding technical analysis starts with reading charts. This guide goes beyond the basics — covering the candlestick patterns and chart patterns that traders use most, and how to interpret them in practice.
If you’re new to technical analysis, start with our guide What Is Technical Analysis in Crypto? before this one.
Part 1: Reading Candlesticks
Each candlestick tells a story about the battle between buyers and sellers during that time period.
Quick anatomy recap:
- Body: Range between open and close price
- Upper wick: How high price traveled above the body
- Lower wick: How low price traveled below the body
- Green candle: Closed higher than opened (buyers won)
- Red candle: Closed lower than opened (sellers won)
The key to reading candles is understanding what the body and wicks tell you about conviction:
Large body, small wicks: Strong conviction. Buyers (green) or sellers (red) dominated the entire session with little pushback.
Small body, large wicks: Indecision. Price moved significantly in both directions but settled near where it started. Neither buyers nor sellers dominated decisively.
Small body, long lower wick: Sellers pushed price down significantly during the session, but buyers recovered most of the loss. Bullish signal — buyers are rejecting lower prices.
Small body, long upper wick: Buyers pushed price up significantly but sellers pushed it back down. Bearish signal — sellers are rejecting higher prices.
Key Single-Candle Patterns
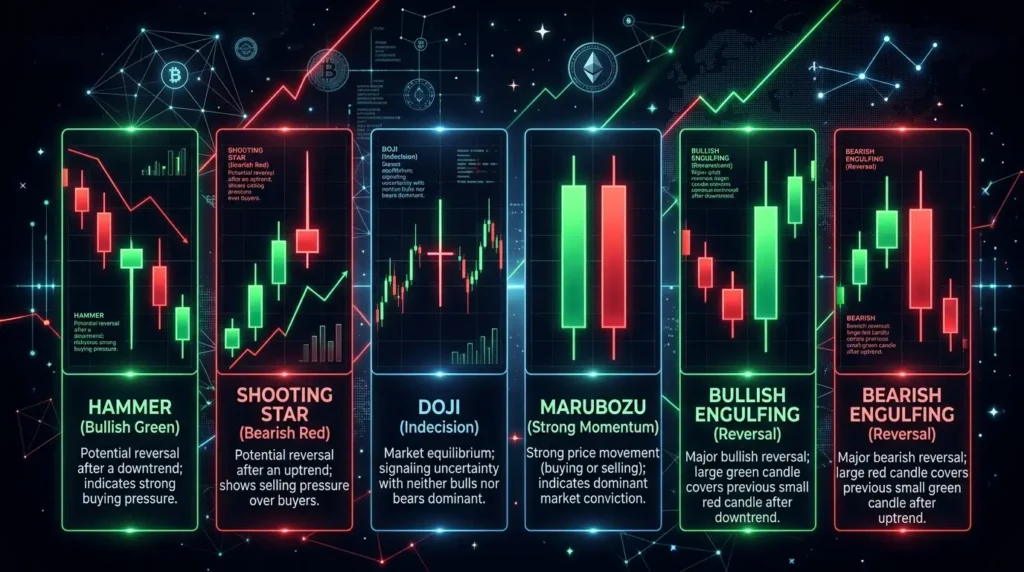
Hammer (Bullish)
Appearance: Small body at the top, long lower wick (at least 2x the body length), little or no upper wick.
What it means: Price fell sharply during the session, but buyers stepped in strongly and pushed it back up near the open. Strong buying pressure rejecting lower prices.
When it signals: Appears after a downtrend at or near a support level. Suggests the selling pressure is exhausting and a reversal may follow.
Confirmation: The next candle should close green and above the hammer’s body to confirm.
Inverted Hammer (Potential Bullish Reversal)
Appearance: Small body at the bottom, long upper wick, little or no lower wick. Appears in a downtrend.
What it means: Buyers pushed price up during the session but sellers brought it back down. However, the attempt itself suggests buying interest is emerging.
Key difference from Shooting Star: The Inverted Hammer appears at the bottom of a downtrend (potential bullish reversal). The Shooting Star appears at the top of an uptrend (potential bearish reversal). Same shape, different context.
Shooting Star (Bearish)
Appearance: Small body at the bottom, long upper wick. Appears after an uptrend.
What it means: Buyers pushed price up significantly during the session, but sellers overwhelmed them and pushed it back near the open. Sellers are rejecting higher prices.
When it signals: Appears after an uptrend at or near a resistance level. Suggests the buying momentum may be exhausting.
Doji
Appearance: The open and close prices are almost identical — body is extremely small or nonexistent. Can have wicks of various lengths.
What it means: Complete indecision. Buyers and sellers reached equilibrium — neither side dominated. On its own it means nothing, but in context it can be significant.
Types:
- Standard Doji: Small body with roughly equal wicks
- Dragonfly Doji: No upper wick, long lower wick. Bullish — strong rejection of lower prices
- Gravestone Doji: Long upper wick, no lower wick. Bearish — strong rejection of higher prices
In context: A Doji after a long uptrend signals potential exhaustion and reversal. A Doji at support can signal the downtrend is losing momentum.
Marubozu
Appearance: Large body with no wicks (or very minimal). The candle opens at the low (bullish marubozu) or the high (bearish marubozu) and closes at the opposite extreme.
What it means: Absolute dominance by one side. A bullish marubozu means buyers controlled the entire session from open to close with no pushback. A bearish marubozu means sellers dominated completely.
Significance: Strong momentum continuation candles.
Key Two-Candle Patterns
Bullish Engulfing
Appearance: A small red candle followed by a large green candle whose body completely “engulfs” (covers) the previous red candle’s body.
What it means: Sellers were in control (red candle), but buyers overwhelmed them completely in the next session (large green candle). Abrupt sentiment shift.
Strongest when: Appears at the bottom of a downtrend at a support level. Volume on the engulfing candle should be higher than the previous candle.
Bearish Engulfing
Appearance: A small green candle followed by a large red candle that completely engulfs the green body.
What it means: Buyers were in control, then sellers took over decisively. Bearish reversal signal.
Strongest when: Appears at the top of an uptrend at a resistance level.
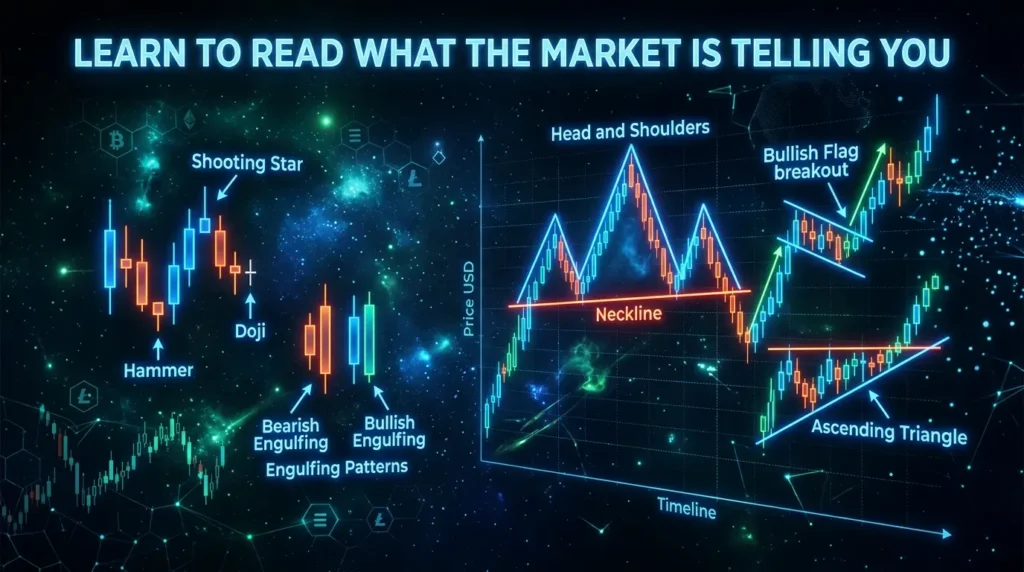
Part 2: Chart Patterns
Chart patterns are formations created by a series of candlesticks that signal potential future price movements. They fall into two categories:
Reversal patterns: Signal a change in the existing trend direction.
Continuation patterns: Signal the current trend will likely resume after a pause.
Major Reversal Patterns
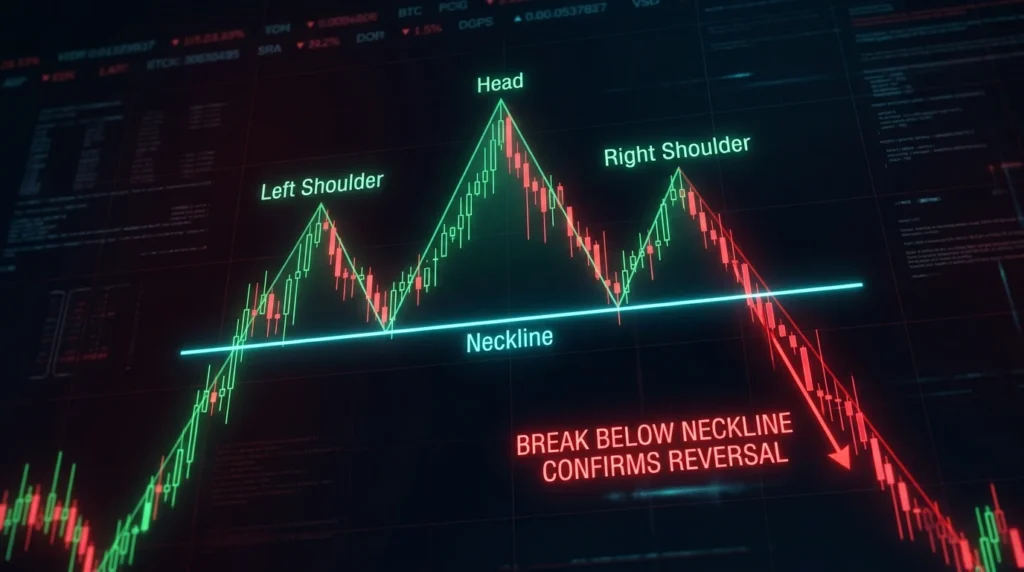
Head and Shoulders (Bearish Reversal)
One of the most well-known and reliable reversal patterns.
Formation:
- Left shoulder: Price rises to a high, then pulls back
- Head: Price rises to a higher high (above left shoulder), then pulls back
- Right shoulder: Price rises again but only to approximately the same level as the left shoulder, then pulls back
- Neckline: The support line connecting the lows between the shoulders and head
Signal: When price breaks below the neckline after the right shoulder forms, it signals a bearish trend change.
Price target: The approximate distance from the neckline to the head — measured downward from the breakout point.
Reliability: Higher on longer timeframes (daily/weekly). One of the most studied patterns in technical analysis.
Inverse Head and Shoulders (Bullish Reversal)
The mirror image of the Head and Shoulders, forming at the bottom of a downtrend.
Formation: Left shoulder (low), Head (lower low), Right shoulder (low approximately equal to left), Neckline (resistance connecting the highs).
Signal: Breakout above the neckline signals a bullish trend change.
Double Top (Bearish Reversal)
Formation: Price reaches a resistance level, pulls back, rallies back to approximately the same resistance level, then fails to break through and begins declining.
Appearance: Looks like the letter “M.”
Signal: Confirmed when price breaks below the level of the trough between the two tops (the “neckline”). The more similar the two peaks in price, the stronger the pattern.
Double Bottom (Bullish Reversal)
The mirror of the Double Top — price reaches support twice without breaking through, then rallies.
Appearance: Looks like the letter “W.”
Signal: Confirmed when price breaks above the level of the peak between the two bottoms.
Major Continuation Patterns
Ascending Triangle (Bullish Continuation)
Formation: A horizontal resistance line at the top, with a series of higher lows forming a rising support line below. The pattern “tightens” as price consolidates.
What it means: Buyers are increasingly aggressive (higher lows) while a fixed supply of sellers exists at the resistance level.
Signal: Breakout above the horizontal resistance, ideally with high volume.
Descending Triangle (Bearish Continuation)
Formation: Horizontal support at the bottom, with lower highs forming a descending resistance line.
What it means: Sellers are increasingly aggressive while a fixed demand level holds at support.
Signal: Breakdown below horizontal support.
Symmetrical Triangle
Formation: Both support and resistance converge toward each other, forming a symmetrical wedge. Neither buyers nor sellers dominant.
Signal: Can break either direction — wait for the actual breakout with volume before committing. The direction of the breakout indicates the next move.
Bull Flag (Bullish Continuation)
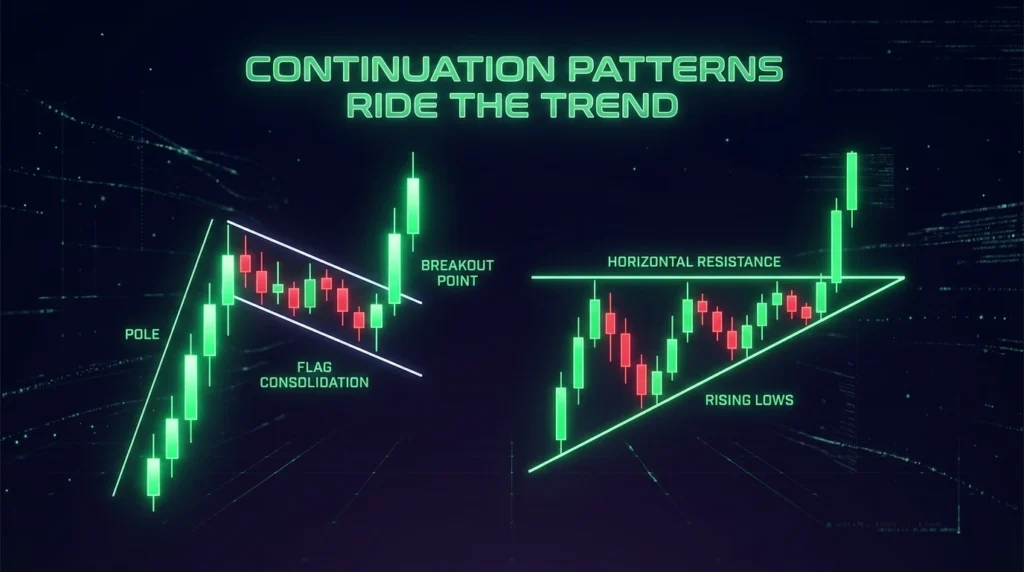
Formation: A strong, nearly vertical upward move (the “flag pole”), followed by a period of relatively orderly, downward-sloping or sideways consolidation (the “flag”).
What it means: After a strong move, price “catches its breath” before continuing higher. Volume typically drops during the flag and expands again on the breakout.
Signal: Breakout above the upper boundary of the flag on increasing volume.
Bear Flag (Bearish Continuation)
The inverse — a sharp downward move followed by an upward-sloping consolidation, then continuation of the decline.
How to Use These Patterns in Practice
Step 1: Identify the trend first
No pattern works in isolation. A bullish engulfing candle is much more significant at a support level during an overall uptrend than it is in the middle of a confirmed downtrend. Always establish the broader context before acting on a pattern.
Step 2: Look for confluence
The strongest signals come when multiple factors align:
- Pattern appears at a key support/resistance level
- Volume confirms the pattern (high volume on breakout candles)
- RSI or another indicator supports the signal (e.g., RSI oversold + hammer = stronger signal)
- Higher timeframe agrees with the direction
Step 3: Define your trade before entering
Before acting on any pattern:
- Where will you enter? (Often at the candle close or on the breakout confirmation)
- Where is your stop-loss? (Usually just beyond the pattern’s invalidation point)
- What is your profit target? (Based on measured move or resistance level)
Step 4: Volume confirmation
Always check volume on the confirming candle or breakout. A Head and Shoulders neckline break on low volume is significantly less reliable than the same break on high volume.
Step 5: Respect invalidation
Every pattern has an invalidation point — a price level at which the pattern is no longer valid. Define it before entering. If price reaches that level, exit your position regardless of conviction.
Common Pattern Trading Mistakes
Acting before confirmation: Buying the pattern before it completes. A Head and Shoulders isn’t confirmed until the neckline breaks. A hammer isn’t confirmed until the next candle closes bullish. Patience pays.
Forcing patterns: Seeing patterns that aren’t really there. If you’re struggling to identify a clear pattern, it probably isn’t there. Move on to a clearer setup.
Ignoring the higher timeframe: A bullish pattern on the 15-minute chart means little if the daily chart is in a downtrend.
Overlooking volume: Patterns confirmed by strong volume are significantly more reliable. Low-volume breakouts fail often.
No stop-loss: Pattern trading without a stop-loss means one wrong call can undo multiple winning trades.
Key Terminology
Hammer: Bullish single-candle pattern — small body, long lower wick, appears after a downtrend.
Shooting Star: Bearish single-candle pattern — small body, long upper wick, appears after an uptrend.
Doji: Candle with minimal body — open and close nearly identical. Signals indecision.
Marubozu: Candle with no wicks — complete dominance by buyers or sellers.
Engulfing Pattern: Two-candle pattern where the second candle’s body completely covers the first.
Head and Shoulders: Classic three-peak reversal pattern — predicts bearish reversal when neckline breaks.
Double Top/Bottom: Two-peak/trough pattern at the same level — reversal signal when neckline breaks.
Triangle: Continuation pattern where support and resistance lines converge.
Bull Flag: Continuation pattern — sharp move up followed by orderly pullback then continuation.
Confluence: Multiple technical factors aligning at the same level — increases signal reliability.
Invalidation: The price level at which a pattern or trade thesis is no longer valid.
The Bottom Line
Chart and candlestick patterns are tools — not guarantees. Every pattern fails sometimes. The advantage they provide comes from:
- Defining clear entry and exit levels
- Creating asymmetric risk-reward setups
- Providing objective decision criteria rather than emotional reactions
Practice on TradingView’s free platform. Look at historical charts and identify patterns in hindsight. Then track future patterns forward without money before applying real capital.
The best traders don’t see patterns everywhere. They wait for high-quality setups with multiple confirming factors — and pass on everything else. 📊
Disclaimer: This article is for informational purposes only and does not constitute financial advice. Cryptocurrency investments carry significant risk, including the potential loss of all invested capital. Technical analysis does not guarantee profitable outcomes. Always conduct your own research before making investment decisions.


")
")