When you open a crypto exchange’s advanced trading interface for the first time, you’re confronted with something that looks more like an aircraft cockpit than a financial tool — price charts covered in lines, colored candles, and indicators scrolling across the bottom.
This is the domain of technical analysis — the practice of studying price charts and trading data to make decisions about buying and selling.
Technical analysis won’t make you a guaranteed winner. But understanding its foundations changes how you see markets — and gives you a structured framework for decision-making rather than pure guesswork.
What Is Technical Analysis?
Technical analysis (TA) is the study of historical price movements and trading volume to forecast future price behavior.
It rests on three core assumptions:
1. The market discounts everything
All known information — news, fundamentals, investor sentiment — is already reflected in the price. You don’t need to analyze the technology behind a coin separately; the price already incorporates the market’s collective judgment.
2. Prices move in trends
Markets don’t move randomly. Once a trend is established (upward, downward, or sideways), it tends to continue until something causes a reversal. TA helps identify these trends and their potential turning points.
3. History tends to repeat itself
Human psychology drives market behavior. Fear and greed create predictable patterns that repeat across different assets and different time periods. TA identifies these recurring patterns.
Technical Analysis vs. Fundamental Analysis
These are the two primary schools of market analysis, and they approach valuation from completely different directions.
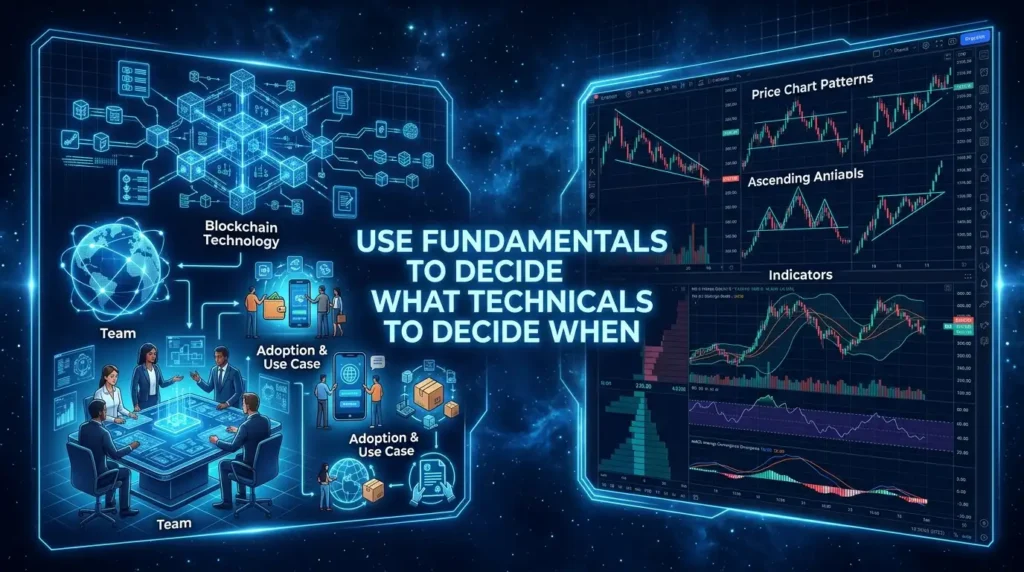
Fundamental Analysis (FA) evaluates the underlying value of an asset:
- What problem does this blockchain solve?
- How large is the development team and community?
- What is the tokenomics — supply, distribution, inflation rate?
- Who are the partners and institutional backers?
- What is the real-world adoption and use case?
FA asks: “Is this asset worth owning at its current price?”
Technical Analysis (TA) ignores fundamentals entirely and focuses on price and volume:
- Where has price been?
- What patterns are forming?
- Is momentum building or fading?
- Where are buyers and sellers concentrated?
TA asks: “Where is price likely to go from here?”
Which is better?
Neither — they serve different purposes and timeframes. Long-term investors often rely more on fundamentals. Active traders lean on technical analysis for timing entries and exits. Most experienced crypto participants use both: fundamentals to decide what to buy, technicals to decide when to buy it.
The Core Components of Technical Analysis
1. Price Charts
The foundation of all TA. A price chart displays how an asset’s price has changed over time, with the x-axis showing time and the y-axis showing price.
Three main chart types:
Line chart: Connects closing prices with a single line. Clean and simple — useful for seeing the big picture trend, but loses detail about what happened within each period.
Bar chart: Shows open, high, low, and close for each period as a vertical bar with tick marks. More information than a line chart, less visual than candlesticks.
Candlestick chart: The most widely used. Each “candle” shows:
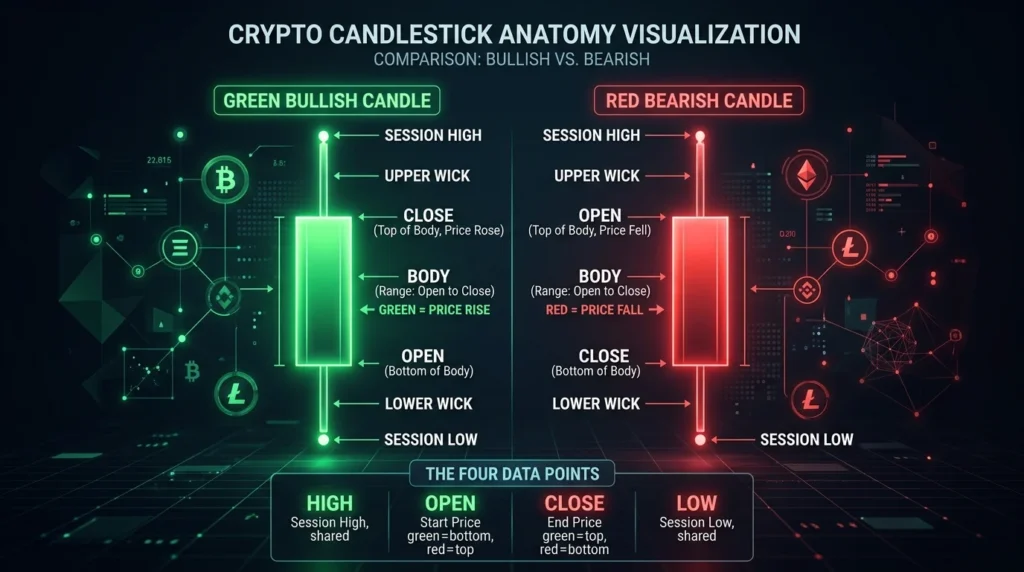
- Body: The range between the opening and closing price
- Upper wick: The highest price reached during the period
- Lower wick: The lowest price reached during the period
- Color: Green (or white) = price closed higher than it opened (bullish). Red (or black) = price closed lower than it opened (bearish).
Candlestick charts are the standard in crypto trading. They provide more information per candle than any other chart type and form recognizable patterns that traders use for signals.
2. Timeframes
Every chart can be displayed at different timeframes — each candle represents a different duration of time.
| Timeframe | Each candle represents | Typical use |
|---|---|---|
| 1 minute | 60 seconds | Scalping only |
| 15 minutes | 15 minutes | Short-term day trading |
| 1 hour | 1 hour | Day trading, swing trading |
| 4 hours | 4 hours | Swing trading |
| Daily (1D) | 1 day | Swing trading, trend analysis |
| Weekly (1W) | 7 days | Long-term trend analysis |
| Monthly (1M) | 30 days | Macro trend analysis |
Key principle: Higher timeframes carry more weight. A pattern on the weekly chart is significantly more reliable than the same pattern on a 15-minute chart. Start your analysis on higher timeframes (daily/weekly) to understand the overall trend, then drop to lower timeframes to refine your entry timing.
3. Support and Resistance
The most fundamental concept in technical analysis — and one of the most practically useful.
Support: A price level where buying pressure has historically been strong enough to stop or reverse a downward move. Think of it as a “floor” — price tends to bounce at this level.
Resistance: A price level where selling pressure has historically been strong enough to stop or reverse an upward move. Think of it as a “ceiling” — price tends to reverse at this level.
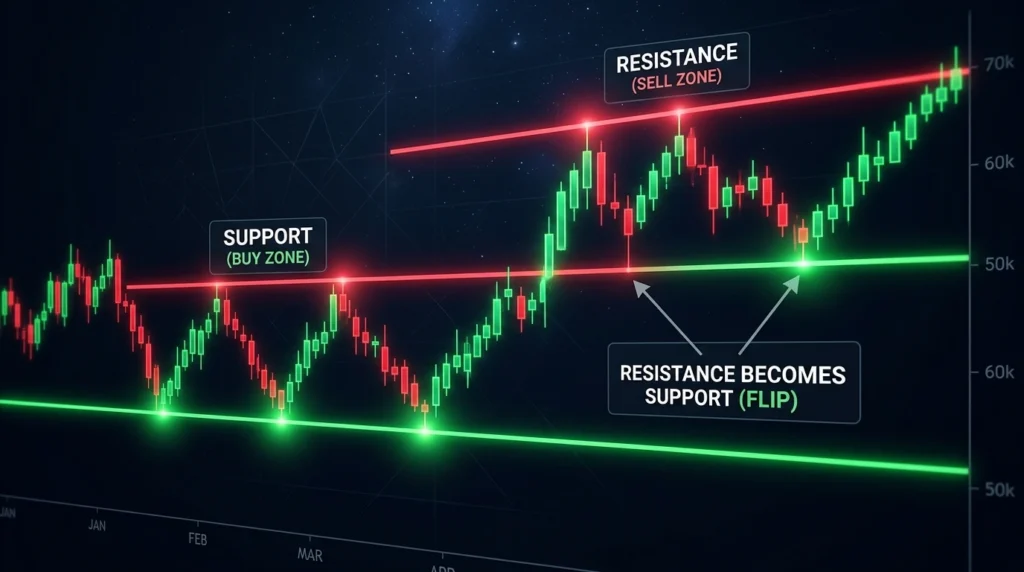
Why these levels work:
- At support: traders who bought at this level before are happy to buy again. Sellers who missed the previous bottom want to accumulate here.
- At resistance: traders who bought near this level before want to exit at breakeven. Those who shorted near this level are happy to add to positions.
Support becomes resistance, and resistance becomes support:
One of the most reliable observations in technical analysis. A level that was previously strong resistance — once broken convincingly to the upside — often becomes support on subsequent pullbacks.
4. Trend Analysis
Technical analysis assumes prices move in trends. Identifying the trend direction is the most important skill to develop.
Uptrend (bullish trend): Characterized by higher highs (each successive peak is higher than the last) and higher lows (each pullback finds support at a higher level than the previous pullback).
Downtrend (bearish trend): Lower highs and lower lows — price makes lower peaks and finds support at progressively lower levels.
Sideways/ranging market: No clear directional bias. Price oscillates between support and resistance within a defined range.
Trend lines: Drawn by connecting two or more swing lows (for an uptrend) or swing highs (for a downtrend). They provide a visual representation of the trend and can act as dynamic support or resistance.
5. Volume
Volume is the total amount of an asset traded during a given period. It’s one of the most important but often overlooked components of technical analysis.
Why volume matters:
Price movements accompanied by high volume are more significant than the same price movements on low volume.
- Price breaks out upward with high volume: Strong bullish signal — many participants are participating in the move.
- Price breaks out upward with low volume: Suspect — may be a “fake breakout” that quickly reverses.
- Price falls with high volume: Strong selling pressure — the move is significant.
- Price falls on low volume during an uptrend: May be normal pullback, not a trend reversal.
Volume is the confirmation tool. Before acting on any price signal, check whether volume supports it.
6. Indicators
Indicators are mathematical calculations applied to price and/or volume data to help identify trends, momentum, and potential reversal points.
Beginners often make the mistake of filling their charts with dozens of indicators simultaneously — creating “analysis paralysis” and conflicting signals. Start with three or four and learn them deeply.
The most essential indicators for crypto:
Moving Averages (MA/EMA): Smooth out price data to identify trends. The 50-day and 200-day moving averages are widely watched. When price is above the 200-day MA, it’s broadly bullish; below is bearish.
RSI (Relative Strength Index): Oscillator measuring momentum on a scale of 0–100. Above 70 typically indicates overbought conditions; below 30 indicates oversold. Useful for identifying potential reversals and divergences.
MACD (Moving Average Convergence Divergence): Shows the relationship between two moving averages. MACD line crossing above the signal line is bullish; crossing below is bearish.
Bollinger Bands: Three bands (upper, middle, lower) that expand and contract with volatility. Price touching the upper band in an uptrend can indicate continuation; touching the lower in a downtrend, the same.
Volume: Not a traditional “indicator” but treated as one. Always visible at the bottom of any chart.
(Detailed guides to each indicator will be covered in upcoming articles.)
Where to Practice Technical Analysis
TradingView is the go-to platform for crypto chart analysis:
- Free tier includes Bitcoin, Ethereum, and thousands of altcoins
- All major indicators available
- Paper trading (simulated trades without real money)
- Available on web and mobile
Most major exchanges (Coinbase Advanced, Kraken Pro, Binance) also have built-in charting tools sufficient for basic analysis.
Practice recommendation: Spend time on TradingView in paper trading mode before applying TA to real positions. Identify levels, draw trend lines, apply indicators — then track whether your analysis proved correct. This feedback loop builds skill without financial risk.
Important Limitations of Technical Analysis
Technical analysis is a tool, not a crystal ball. Understanding its limitations is as important as understanding its applications.
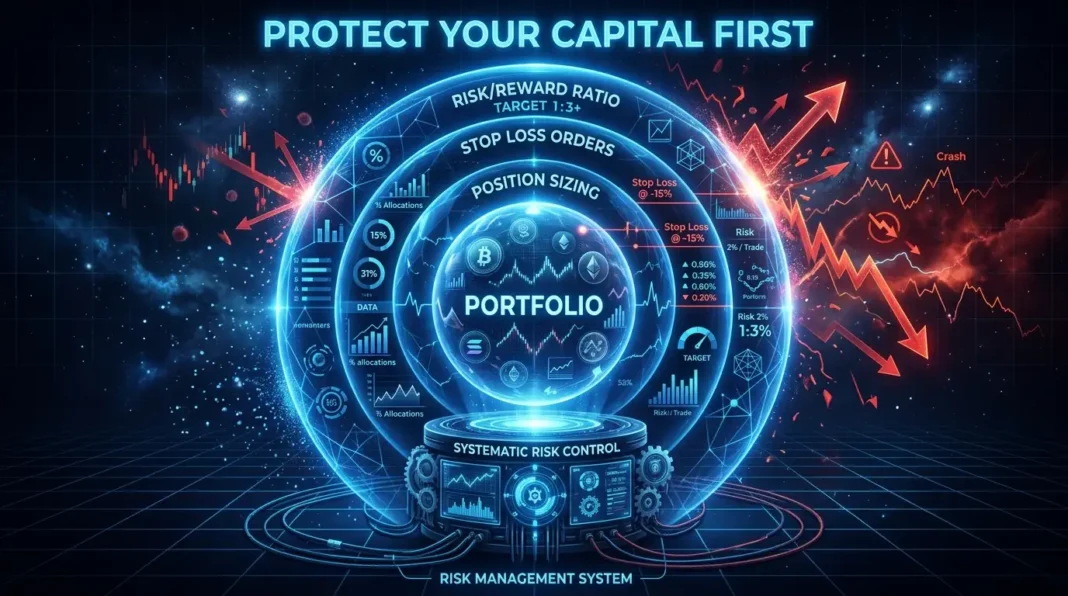
False signals: Even the most reliable patterns fail regularly. No indicator or pattern works 100% of the time. Always use TA within a risk management framework — define your stop-loss before entering any trade.
Crypto-specific challenges: Crypto markets are younger, less liquid (especially altcoins), and more susceptible to manipulation than traditional markets. Technical patterns that work reliably in stocks may be disrupted more frequently in crypto due to thin liquidity, whale activity, and sudden regulatory or news events.
Timeframe conflicts: A bullish signal on a 1-hour chart can exist simultaneously with a bearish signal on the daily chart. Always resolve conflicts by giving priority to the higher timeframe.
Self-fulfilling prophecy: Because many traders watch the same key levels and indicators, they can become self-fulfilling. A widely-watched support level may hold simply because enough traders expect it to and buy there. This is a feature and a limitation — patterns work in part because of their popularity, but can also be exploited by larger players who understand this.
Doesn’t account for news: A technically perfect setup can be invalidated in minutes by unexpected regulatory news, a major hack, or a significant macro event. Always be aware of upcoming events that could override your technical analysis.
Technical Analysis and Long-Term Investors
TA isn’t only for active traders. Long-term investors can use basic technical analysis to:
- Improve entry timing: Instead of buying a lump sum immediately, wait for a pullback to a support level or moving average — potentially buying at a better price.
- Identify trend direction: Buying into a clear uptrend is statistically better than buying into a downtrend and hoping for reversal.
- Set stop-losses: Even long-term holdings benefit from knowing at what technical level the thesis is invalidated.
DCA (Dollar-Cost Averaging) removes the need for TA entirely by automating purchase timing. But for investors who want to be more deliberate about entry points, basic TA provides a useful framework.
Key Terminology
Candlestick: A chart element showing the open, high, low, and close price for a specific time period.
Support: A price level where buying interest has historically prevented further decline.
Resistance: A price level where selling interest has historically prevented further advance.
Trend: The general direction of price movement — uptrend (higher highs and higher lows), downtrend (lower highs and lower lows), or sideways.
Volume: The total amount of an asset traded during a period — confirms the strength of price movements.
RSI: Relative Strength Index — momentum oscillator measuring overbought/oversold conditions.
MACD: Moving Average Convergence Divergence — indicator showing momentum and trend changes.
Moving Average (MA/EMA): Smoothed price average over a defined period — helps identify trend direction.
Timeframe: The duration each candle represents on a chart (1 minute, 1 hour, 1 day, etc.).
TradingView: The most popular charting platform for crypto technical analysis.
The Bottom Line
Technical analysis is a structured way of reading market behavior. It won’t predict the future with certainty — nothing does. But it provides a shared language for understanding price action, a framework for identifying potential entry and exit points, and tools for managing risk more systematically.
Start simple:
- Learn to read candlestick charts
- Identify support and resistance levels
- Understand trends (higher highs/higher lows vs. lower highs/lower lows)
- Add one indicator at a time — RSI is a good starting point
- Practice on TradingView in paper trading mode
- Always combine TA with risk management — a stop-loss on every trade
Technical analysis is a skill that develops over time. The first charts you analyze will look confusing. After a few months of consistent practice, patterns begin to emerge naturally. The market teaches you — one chart at a time. 📊
Disclaimer: This article is for informational purposes only and does not constitute financial advice. Cryptocurrency investments carry significant risk, including the potential loss of all invested capital. Technical analysis does not guarantee profitable outcomes. Always conduct your own research and consider consulting a qualified financial advisor before making investment decisions.