
When someone says “Bitcoin is the largest cryptocurrency,” they’re not talking about its price per coin. They’re talking about its market capitalization — one of the most fundamental metrics in crypto investing.
Understanding market cap changes how you evaluate crypto assets. It explains why a $1 coin isn’t necessarily “cheap” and a $60,000 coin isn’t necessarily “expensive.” It helps you understand relative size, risk, and potential in a way that price alone never can.
What Is Market Capitalization?
Market capitalization (market cap) is the total value of all coins or tokens of a cryptocurrency currently in circulation.
The formula is simple:
Market Cap = Current Price × Circulating Supply
Example:
- Bitcoin price: $78,000
- Bitcoin circulating supply: ~19.8 million BTC
- Bitcoin market cap: $78,000 × 19,800,000 = ~$1.54 trillion
This number tells you the total dollar value the market is assigning to Bitcoin as a whole — not just one coin.
Why Price Alone Is Misleading
This is one of the most important concepts for new crypto investors.
Example: Suppose two tokens:
- Token A: $10,000 per coin, 1,000 coins in existence → Market cap = $10 million
- Token B: $0.001 per coin, 100 billion coins in existence → Market cap = $100 million
Token B is 10x larger than Token A by market cap — even though each coin costs $0.001 vs $10,000.
A coin priced at $0.001 is not “cheap” just because the number is small. A coin priced at $60,000 is not “expensive” just because the number is large. What matters is the total market value — the market cap.
Practical implication: “This coin is only $0.001, it could easily go to $1!” requires multiplying by the circulating supply. If there are 100 billion tokens, a price of $1 means a $100 billion market cap — which would make it larger than most established companies in the world. Ask whether that’s realistic before assuming upside.
The Three Market Cap Categories
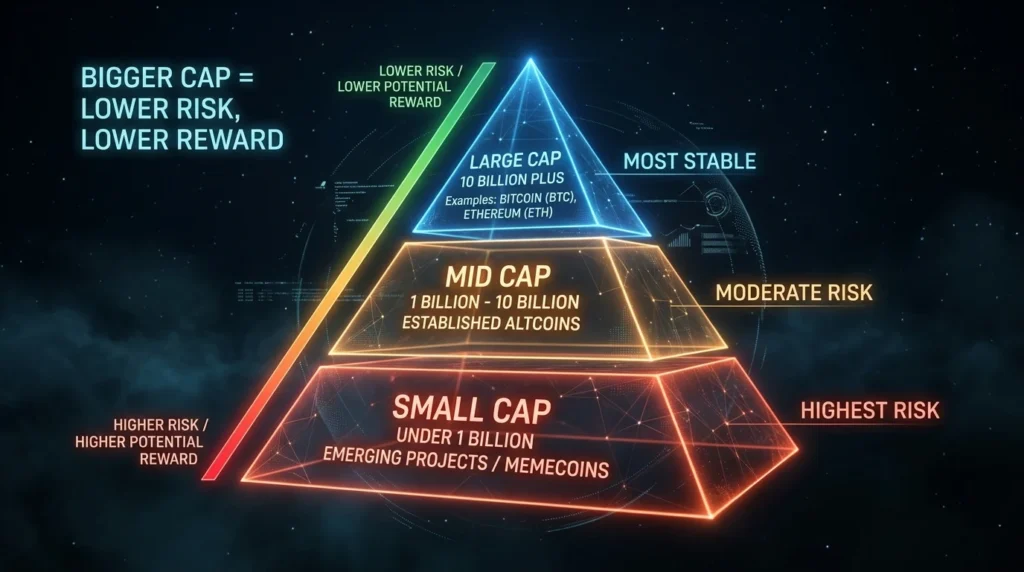
Crypto assets are broadly classified into three tiers based on market cap size. While definitions vary, these are commonly used frameworks:
Large-Cap (Generally $10 billion+)
The most established cryptocurrencies with the longest track records, deepest liquidity, and broadest institutional adoption.
Examples (2026): Bitcoin (BTC), Ethereum (ETH), BNB, Solana (SOL), XRP
Characteristics:
- Lower volatility relative to mid and small-cap assets (though still highly volatile by traditional standards)
- Deep liquidity — large amounts can be bought/sold without dramatically moving the price
- Widely covered by institutional research and media
- Generally safer for significant capital allocation
- Lower potential for explosive short-term gains, but higher probability of survival long-term
Mid-Cap (Generally $1 billion – $10 billion)
Established projects with real adoption but more room for growth — and significantly more risk.
Examples: Chainlink (LINK), Avalanche (AVAX), Polkadot (DOT), Litecoin (LTC), Cardano (ADA)
Characteristics:
- Higher volatility than large-caps
- More sensitive to market sentiment shifts
- Can deliver significantly higher returns in bull markets
- Higher risk of sustained underperformance or failure compared to large-caps
- Less institutional coverage, more speculative
Small-Cap (Generally under $1 billion)
Newer, less established projects. High potential, high risk.
Characteristics:
- Highly volatile — can move 50–100%+ in days
- Low liquidity — thin order books, wide spreads
- More susceptible to manipulation
- Many fail — survival rate is much lower than large or mid-cap assets
- Occasional 10–100x gains in bull markets attract speculative capital
The risk reality: The vast majority of small-cap tokens that existed in 2020 are worth significantly less today or have ceased trading entirely. For every 10x success story, there are many more that went to near-zero.
Total Crypto Market Cap
Beyond individual assets, the total crypto market cap tracks the combined value of all cryptocurrencies.
As of April 2026: The total crypto market cap is approximately $2.5–2.6 trillion.
Why it matters:
- Rising total market cap generally signals broad market growth (crypto bull market)
- Declining total market cap signals broad selling (bear market)
- The total market cap’s relationship to Bitcoin’s dominance reveals money flows within the crypto ecosystem
Bitcoin Dominance: A Key Derived Metric

Bitcoin Dominance = Bitcoin’s market cap ÷ Total crypto market cap × 100
This percentage tells you what fraction of the total crypto market is represented by Bitcoin alone.
As of April 2026: Bitcoin dominance is approximately 57–58%.
How to interpret it:
Rising Bitcoin dominance:
- Investors are moving from altcoins into Bitcoin (risk-off behavior)
- Often happens during crypto bear markets — Bitcoin loses value but altcoins lose more
- Bitcoin is seen as a “safe haven” within crypto
Falling Bitcoin dominance:
- Money is rotating from Bitcoin into altcoins (risk-on behavior)
- Often precedes or accompanies “altcoin season” — when altcoins significantly outperform Bitcoin
- Historically, periods of low Bitcoin dominance have coincided with the most explosive altcoin gains
The dominance cycle:
Bitcoin typically leads a bull market. Ethereum follows. Then broader altcoin season. Understanding where you are in this cycle — using Bitcoin dominance as one indicator — can inform portfolio allocation decisions.
Fully Diluted Valuation (FDV)
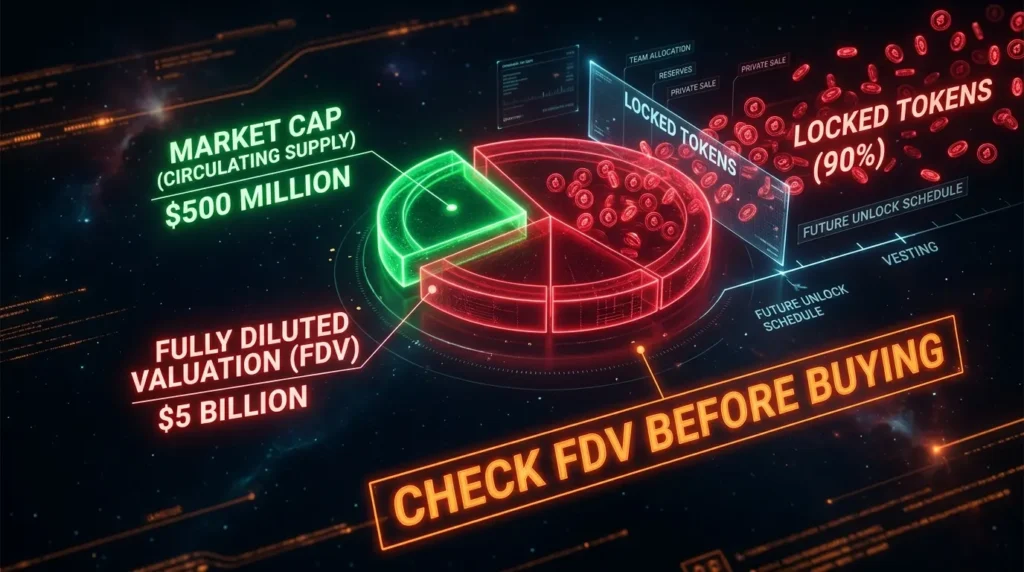
Market cap uses circulating supply — the coins actually in existence and trading today. But many projects have additional tokens locked, vested, or not yet issued.
Fully Diluted Valuation (FDV) = Current Price × Maximum Total Supply
FDV shows what the market cap would be if every token that will ever exist were already in circulation.
Why FDV matters:
If a token has a market cap of $500 million but an FDV of $5 billion — that means 90% of the token supply hasn’t entered circulation yet. As those tokens unlock and enter the market, they create selling pressure. Early investors, team members, and the project foundation hold these tokens and may sell when they unlock.
Red flag: A token trading with a market cap far below its FDV should prompt investigation. Who holds the locked tokens? When do they unlock? What happens to price when they do?
Unlock schedules are typically published on projects’ tokenomics pages and tracked on sites like Token Unlocks (tokenunlocks.app) and Vesting.finance.
Market Cap vs. Volume
Two different but related metrics often confused:
Market Cap: Total value of circulating supply at current price. Measure of size.
24-Hour Trading Volume: Total value of the asset traded across all exchanges in the last 24 hours. Measure of activity.
The ratio matters:
A healthy, liquid market typically shows 24-hour volume that’s a fraction of market cap (5–20% is common for major assets).
Volume-to-market-cap ratio anomalies:
- Very high ratio (24h volume > 50% of market cap): Could indicate manipulation (wash trading) or unusually high speculation
- Very low ratio: Thin, illiquid market — difficult to enter or exit large positions without significantly moving the price
How to Use Market Cap in Investment Decisions
1. Assess Relative Size and Risk
Before buying any cryptocurrency, look up its market cap. A $50 million market cap token carries fundamentally different risk than a $500 billion market cap asset. Allocate your portfolio accordingly — larger allocations to more established assets, smaller speculative allocations to smaller caps.
2. Evaluate “Upside” Realistically
When someone claims a token can “10x from here,” check the math:
- Current market cap × 10 = implied future market cap
- Is that realistic? Compare to similar assets or the total crypto market
A token with a $5 billion market cap reaching 10x would become a $50 billion asset — requiring it to become one of the top 10 largest cryptocurrencies. Not impossible but a much stronger claim than a $50 million cap token 10x-ing to $500 million.
3. Track Bitcoin Dominance for Market Cycle Context
Rising dominance suggests defensiveness — consider weighting toward Bitcoin.
Falling dominance suggests risk-on rotation — historically favorable for altcoins.
4. Check FDV Before Committing
Always compare market cap to FDV. A low market cap relative to FDV means significant future token inflation. Know who holds the unvested supply and when it unlocks.
5. Use Total Market Cap for Macro Context
Is the total crypto market in an uptrend or downtrend? Buying altcoins in a declining total market is swimming against a very strong current.
Where to Find Market Cap Data
CoinMarketCap (coinmarketcap.com): The most widely referenced site. Shows market cap, circulating supply, FDV, volume, and historical data for thousands of tokens.
CoinGecko (coingecko.com): Strong alternative with similar data plus DeFi coverage.
TradingView: Charts with market cap overlays available.
Token Unlocks (tokenunlocks.app): Tracks vesting schedules and upcoming unlock events.
Key Terminology
Market Capitalization (Market Cap): Current price × circulating supply. Total market value of a cryptocurrency.
Circulating Supply: The number of coins or tokens currently in existence and tradeable.
Maximum Supply: The total number of coins that will ever exist (e.g., 21 million for Bitcoin).
Fully Diluted Valuation (FDV): Current price × maximum total supply. Market cap if all tokens were in circulation.
Bitcoin Dominance: Bitcoin’s market cap as a percentage of total crypto market cap.
Total Crypto Market Cap: Combined market cap of all cryptocurrencies.
Volume: Total value of an asset traded in a given period (typically 24 hours).
Large-Cap: Cryptocurrencies with market cap generally above $10 billion.
Mid-Cap: Generally $1 billion to $10 billion market cap.
Small-Cap: Generally below $1 billion market cap.
Token Unlock: When previously locked or vested tokens enter circulation — often creates selling pressure.
The Bottom Line
Market cap is the single most important size metric in crypto. It tells you:
- How large an asset really is (regardless of individual coin price)
- What category of risk you’re taking on (large, mid, small-cap)
- How to evaluate claimed “upside” realistically
- Where capital is flowing within the crypto ecosystem (Bitcoin dominance)
- What future selling pressure might look like (FDV vs market cap)
Before buying any cryptocurrency — check the market cap. Before getting excited about a “cheap” low-price token — multiply by the circulating supply. Before believing in a “100x potential” claim — do the math on what that market cap would mean.
The numbers don’t lie. Learn to read them. 📊
Disclaimer: This article is for informational purposes only and does not constitute financial advice. Cryptocurrency investments carry significant risk, including the potential loss of all invested capital. Always conduct your own research before making any investment decisions.